Townhall.com ^ | March 20, 2013 | Daniel J. Mitchell
The food stamp program seems to be a breeding ground of waste, fraud, and abuse. Some of the horror stories I’ve shared include:
- Using food stamps to buy luxury coffee at Starbucks.
- Buying steaks and lobster with food stamps.
- The Obama Administration rewarding states that sign up more food stamp recipients.
- Proposals to make it easier to use food stamps at fast food restaurants.
- College kids scamming the program for handouts.
- New York City giving food stamps to newly released prisoners and running foreign-language ads encouraging more people to sign up for the program.
- The Octo-Mom mooching off the food stamp program.
- The Agriculture Department running radio ads to lure more people into food stamp dependency.
So exactly how bad is the food stamp program?
One way of measuring the cost of the program, both to taxpayers and to the people who get trapped in dependency, is to see what share of a state’s population is utilizing the program.
I just did a “Mirror, Mirror” post on states with the most education bureaucrats compared to teachers and got a lot of good feedback, so let’s do the same thing for food stamps.
Here’s a rather disturbing map from the Washington Post.
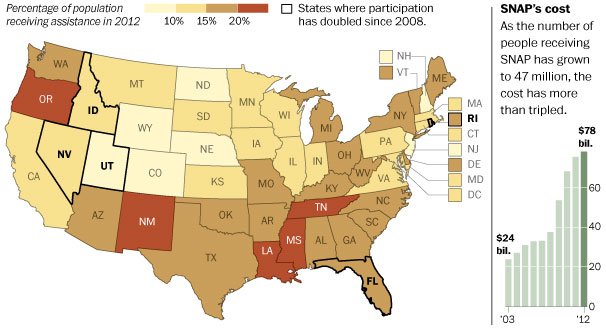
A couple of things stand out. I can understand Mississippi, Louisiana, and New Mexico being among the worst states because they have relatively low average incomes. And that’s sort of an excuse for Tennessee, though it’s worth noting that economically and demographically similar states such as Georgia and Alabama don’t fall into the same dependency trap.

Why such a significant handout culture?
But the state that stands out is Oregon. Based on the state’s income, there’s no reason for more than 20 percent of resident’s to be on the dole. The state does get a “high” ranking on the Moocher Index, so there’s some evidence of an entitlement mentality. And welfare handouts also are above average in the Beaver State as well.
It’s also disappointing to see that food stamp dependency has doubled since 2008 in Florida, Rhode Island, Nevada, Utah, and Idaho. Though it’s a credit to the people of Utah that they’re still in the least-dependent category. But the trend obviously is very bad.
And it’s also depressing to look at the bar chart on the right and see that spending on the program has tripled in the past 10 years. Heck, food stamps were about 70 percent of the cost of a recent Senate “farm bill.”
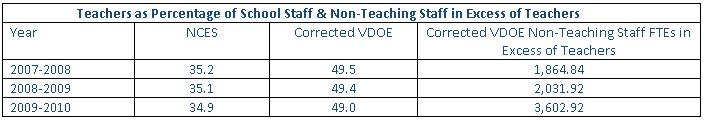
P.S. A local state legislator asked an official in Richmond why Virginia got such a bad score in the ranking of teachers compared to education bureaucrats. The good news, so to speak, is that Virginia is not as bad as suggested by the official numbers. According to the response sent to this lawmaker, “VDOE has determined that the data it reported on school division personnel and assignments to NCES for 2005-2006 through 2009-2010 through the US Department of Education’s EdFacts Portal were inaccurate.”
The bad news, as you can see from this table, is that there are still more edu-crats than teachers, but the ratio apparently isn’t as bad with this updated data.
As a Virginia taxpayer, I suppose I should be happy. But it’s hard to get overly excited when other states are taking positive steps to bring choice and competition to education, and the best thing I can say about the Old Dominion is that we’re not quite as infested with bureaucrats as we originally thought.
P.P.S. I guess I should give the left-wing Washington Post some credit for sharing the map on food stamp dependency. And, to be fair, the paper did reprint this remarkable chart showing how bad Obama’s record is on jobs compared to Reagan and Clinton. And the paper also printed this chart showing how the economy’s performance is way below average under Obama.